
A step in the direction of learning data visualization – a simple and intuitive project
How well has Kohli performed recently? Is the Indian pace attack ready for the English pitches? Who will be chosen to fill the no. 4 slot in the team? How has Bhuvi’s economy been? Can Kedar Jadhav be trusted as an additional spinner?
Few of the many questions that pop up in a cricket enthusiasts mind given the fact that the world-cup is round the corner.
As I read through the article that revealed the players picked in the squad, I typed in ESPN CricInfo URL to look through the player statistics. As I browsed through these players’ numbers I felt the need to intuitively compile all this info in one place. Employing simple functionalities that enable be to browse through a players stats just by hovering over their name with an additional feature of viewing how these players compare with each other.
To that end I decided to compile this information, however, I hit a roadblock since this information was scattered and needed to be compiled in one dataset.
I deployed a web-scraper using R’s rvest library.
install.packages('xml2')
library("rvest")
url <- "http://stats.espncricinfo.com/ci/engine/records/averages/batting.html?class=2;id=6;type=team"


population_ind <- url %>%
  html() %>%
  html_nodes(xpath='//*[@id="ciHomeContentlhs"]/div[3]/div/table[1]') %>%
  html_table()
population_ind <- population_ind[[1]]
head(population_ind)
write.csv(population_ind,'cricketers_ind.csv')


url <- "http://stats.espncricinfo.com/ci/engine/records/averages/bowling.html?class=2;current=2;id=6;type=team"


population_bowl <- url %>%
  html() %>%
  html_nodes(xpath='//*[@id="ciHomeContentlhs"]/div[3]/div/table[1]') %>%
  html_table()
population_bowl <- population_bowl[[1]]
head(population_bowl)
write.csv(population_bowl,'cricketers_bowl.csv')


url <- "http://stats.espncricinfo.com/ci/engine/records/team/series_results.html?class=2;id=6;type=team"


population_team <- url %>%
  html() %>%
  html_nodes(xpath='//*[@id="ciHomeContentlhs"]/div[3]/div/table[1]') %>%
  html_table()
population_team <- population_team[[1]]
head(population_team)
write.csv(population_team,'cricketers_team.csv')
The resultant datasets needed to be combined. I decided to use Tableau Prep for the same. A decision to use Tableau Prep over R to clean and combine datasets was made since Tableau provides a better visual rendition of the process.
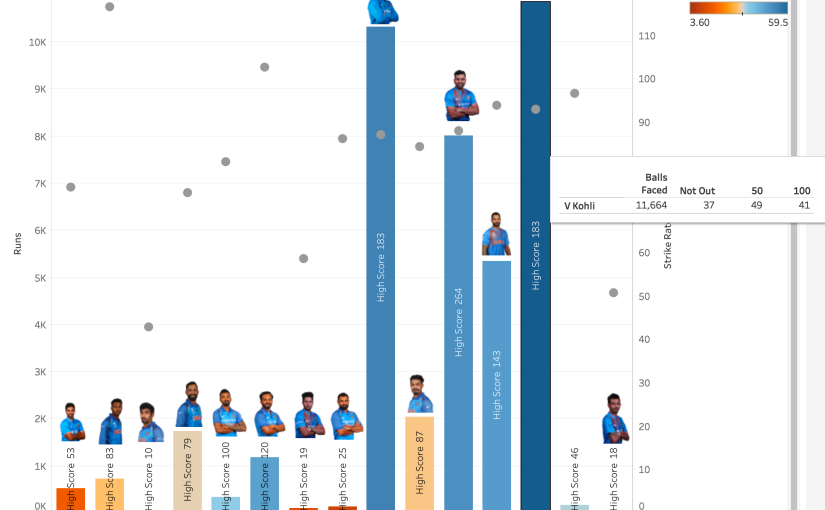
Here is an excerpt from the dashboard I created –
- Batting Statistics


Bowling Statistics


Data Source : http://stats.espncricinfo.com/ci/engine/records/index.html
Entire dashboard can be found on my Tableau Public Profile : https://public.tableau.com/profile/viraj1076#!/
Technology Used : R (rvest) | Tableau Prep | Tableau Desktop 2019 |
